OEE Factors


Getting Started with OEE Factors
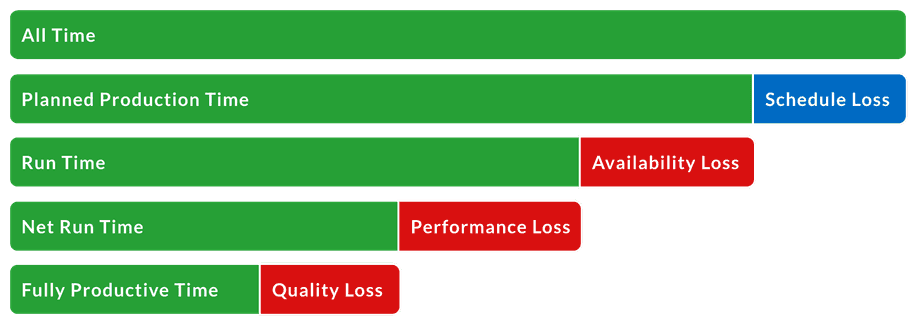
Let’s start at the beginning – with All Time. This is also called 24/7 time (it includes every minute of every day).

From All Time, you subtract Schedule Loss, which includes all time that should be excluded from OEE analysis because there is no intention of running production during this time (e.g., plant shutdowns, breaks/lunches, or periods where there are no orders). Schedule Loss is part of TEEP (Total Effective Equipment Performance). It is not part of OEE.
The remaining time is your Planned Production Time. OEE begins with Planned Production Time and scrutinizes all efficiency and productivity losses that occur within that time, with the goal of reducing or eliminating these losses.

Now we will look at the three OEE factors, each of which takes into account a different type of loss. They are Availability, Performance, and Quality.
OEE Availability
OEE availability is the ratio of Run Time to Planned Production Time. Availability takes into account Availability Loss, which includes any events that stop planned production for an appreciable length of time (usually several minutes, long enough for an operator to log a reason).
Examples of things that create Availability Loss include Unplanned Stops (such as equipment failures and material shortages) and Planned Stops (such as changeover time). Changeover time is included in OEE analysis since it is time that could otherwise be used for manufacturing. While it may not be possible to eliminate changeover time, in most cases, it can be significantly reduced. Reducing changeover time is the goal of SMED (Single-Minute Exchange of Die).
The remaining time after Availability Loss is subtracted is called Run Time.

OEE Performance
OEE performance takes into account Performance Loss, which accounts for anything that causes the manufacturing process to run at less than the maximum possible speed when it is running (including both Slow Cycles and Small Stops).
Examples of things that create Performance Loss include machine wear, substandard materials, misfeeds, and jams.
The remaining time after Performance Loss is subtracted and is called Net Run Time.

OEE Quality
Quality takes into account Quality Loss, which accounts for manufactured parts that do not meet quality standards.
Examples of things that create Quality Loss include scrap and parts that need rework. OEE Quality is similar to First Pass Yield, in that it defines Good Parts as parts that successfully pass through the manufacturing process the first time without needing any rework.
The remaining time after Quality Loss is subtracted is called Fully Productive Time.

Our goal is not simply to measure OEE – it is to maximize Fully Productive Time.
Quick Review
Now that you have taken a look at how the three OEE Factors are defined, we can quickly review each type of loss and its relationship to the OEE factors.
| Loss | OEE Factor |
|---|---|
| Schedule Loss |
|
| Availability Loss |
|
| Performance Loss |
|
| Quality Loss |
|
As you can see, the core concepts of OEE are quite simple and the three OEE Factors really help to focus us on the underlying causes of productivity loss.
We can delve even deeper into productivity losses by understanding the Six Big Losses.
We can also extend OEE analysis a step further by taking into account a fourth factor – Utilization. This takes us into the realm of TEEP.
WHAT YOU SHOULD DO NEXT...
1. Learn more about how our product, Vorne XL, can help you eliminate waste and significantly improve OEE.
Vorne XL is the simplest and fastest way to monitor and improve production. It's a one-time cost and takes just a day to install. And you can try it completely free for 90 days.
Learn More2. Download our FREE package of tools to supercharge your manufacturing productivity
The package includes leadership lessons, training guides, meeting and report templates, summaries of key concepts, project organizers, and more. You'll also receive our monthly newsletter for free. Unsubscribe at any time.
DOWNLOAD FREE LEAN TOOLS3. Sign up for our monthly newsletter
Get free monthly updates with proven methods for improving our manufacturing productivity. Unsubscribe at any time.

